Statistics
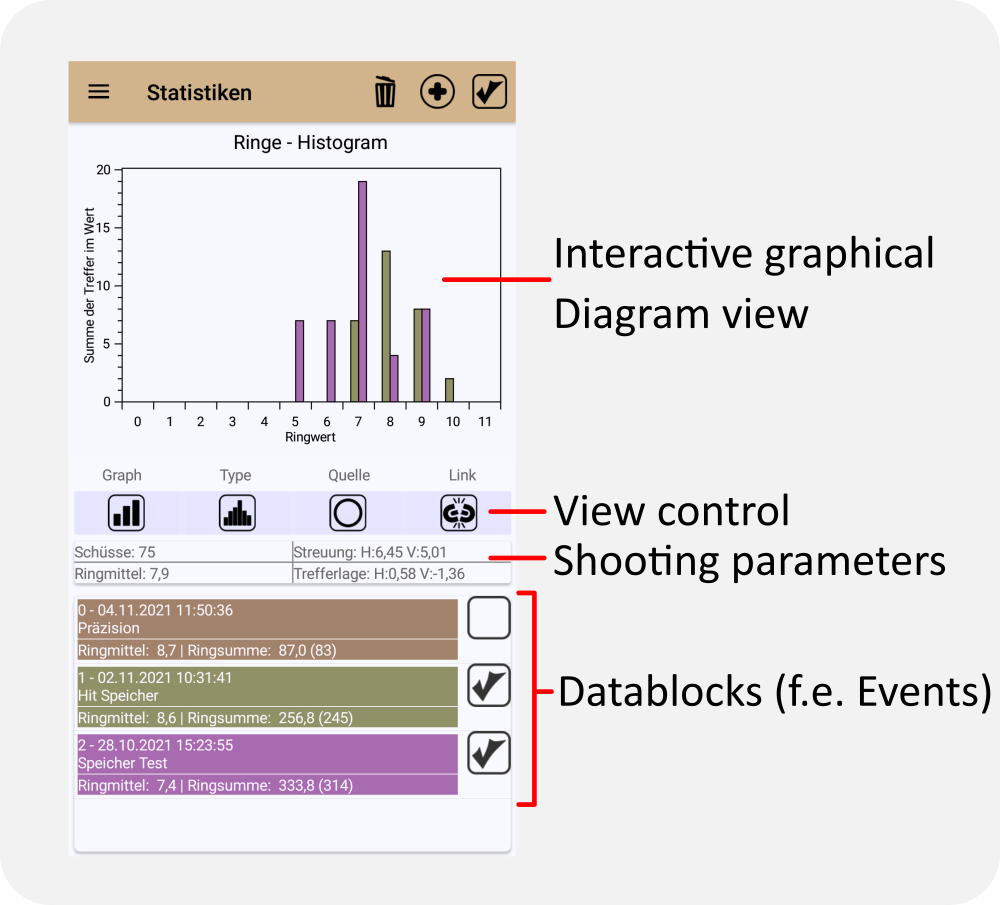
Add data
Here you can add new data from your shooting book to the current statistics page.
Delete all marked data blocks
Data blocks are selected with a check marker. They can then be specifically removed from the statistics.
Mark all or nothing
The button selects or deselects all data blocks loaded in the statistics. This is useful, for example, if you want to evaluate only single blocks or delete all of them.
View control
Graphs

The graphs are only a representation of the data. They do not affect the graph type or the data source. Each type and source can be displayed in any representation.
Line graph

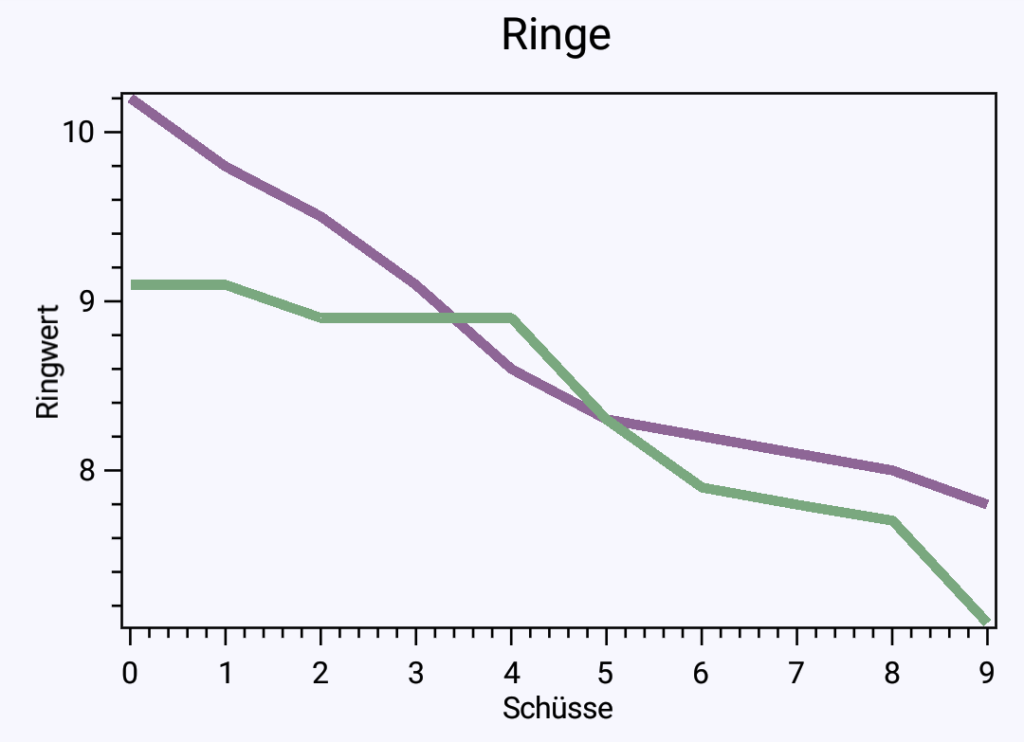
Displays the diagram as a classic line graph. Useful if you want to compare similar hit images. The “straighter” a line, the smaller the scatter of the data.
Bar graph

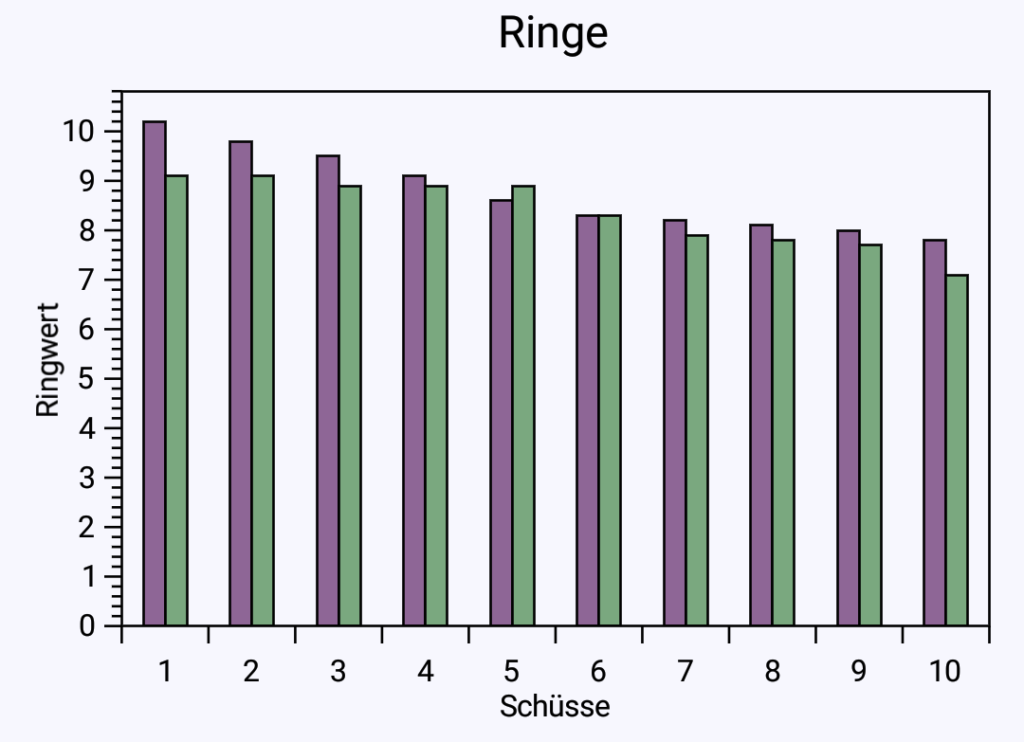
The data is displayed as bars. This plot view is easier to read and clearer for histograms, for example.
Chart types

The chart type determines the calculation method used to process the data before displaying it.
Histogram

A very useful view to quickly overview the quality of a hit pattern or to compare it with other data. In the histogram, all shots of the same value are added up in whole rings and the sum in the individual ring classes is plotted in the chart.
Curve
With the curve type, the values of the data source are plotted 1:1 in the diagram. For some sources this view is more convenient.
Data sources

The data sources contain the actual data values to be displayed in the chart.
Rings
The ring source contains the ring values of the respective data block to the nearest tenth.
Divider
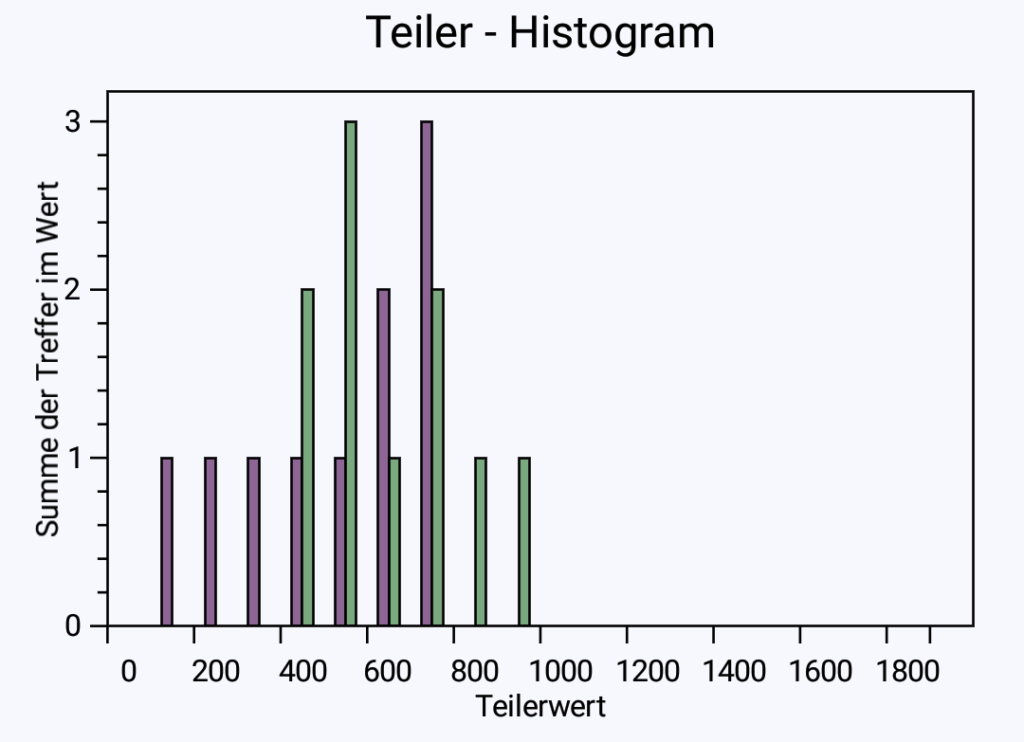
The divider is the distance of the center of a hit to the center of the target in hundredths of a millimeter. It can be used, for example, to make caliber-independent comparisons.
Angle

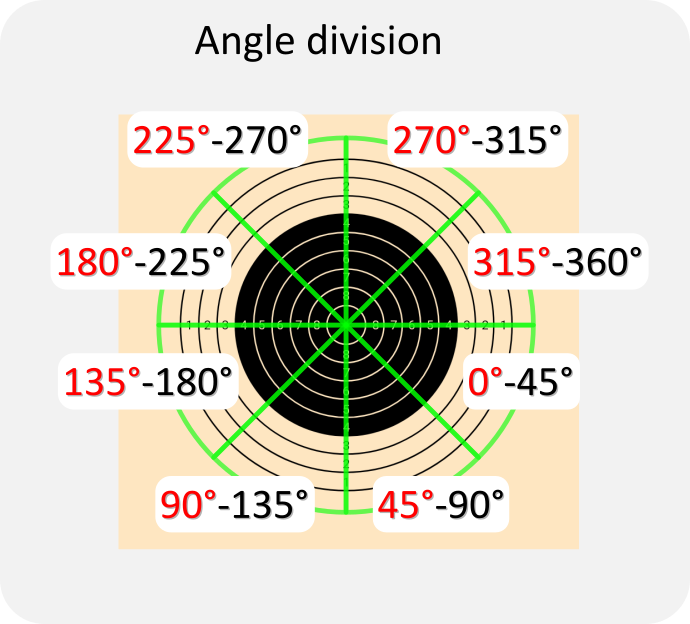
The red angles correspond to the indications of the X axis in the histogram.
For example, if a value is displayed at 45°, the corresponding shots are in the range 45°-90°.
Ring mean

Takes the mean value of the rings of a data block as data source. This option is only useful if you want to compare several hit images or several data blocks. If there is only one data block in the statistics, there is also only one mean value. A good display configuration for this data source is:
- Graph: Bar
- Type: Curve
- Link: Unlinked
Link

The link option controls how the individual data blocks are handled.
Unlinked
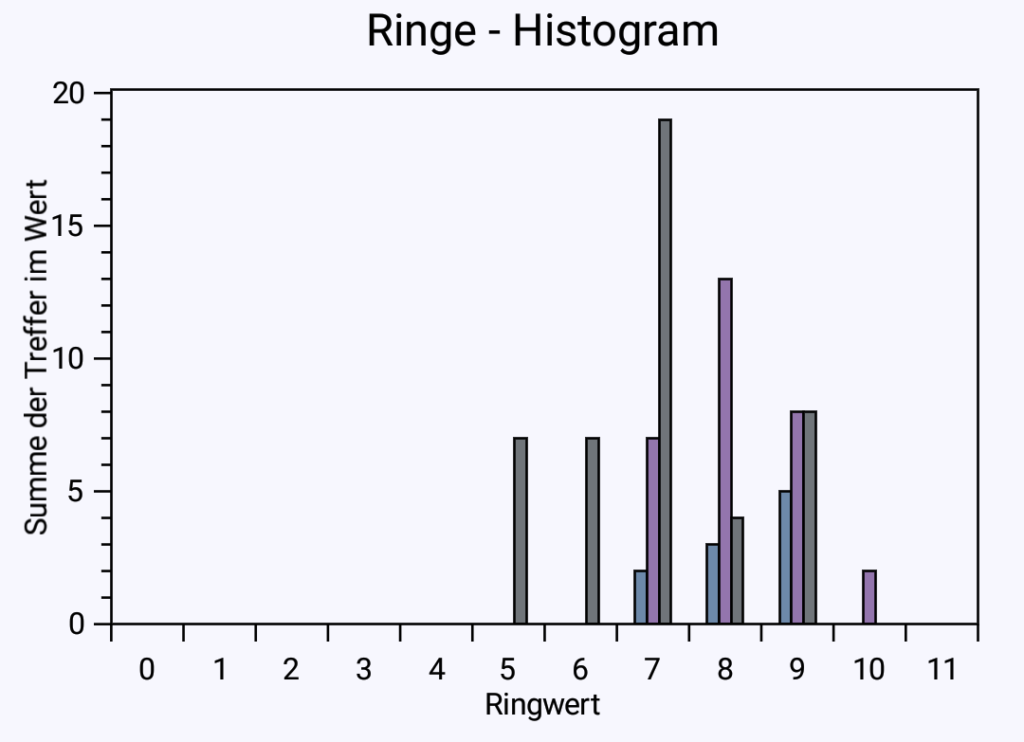
If the data are not linked, each data block is displayed separately in the diagram. The color of the plots corresponds to the colors of the blocks in the list. It can be changed by pressing the blocks in the list.
Linked
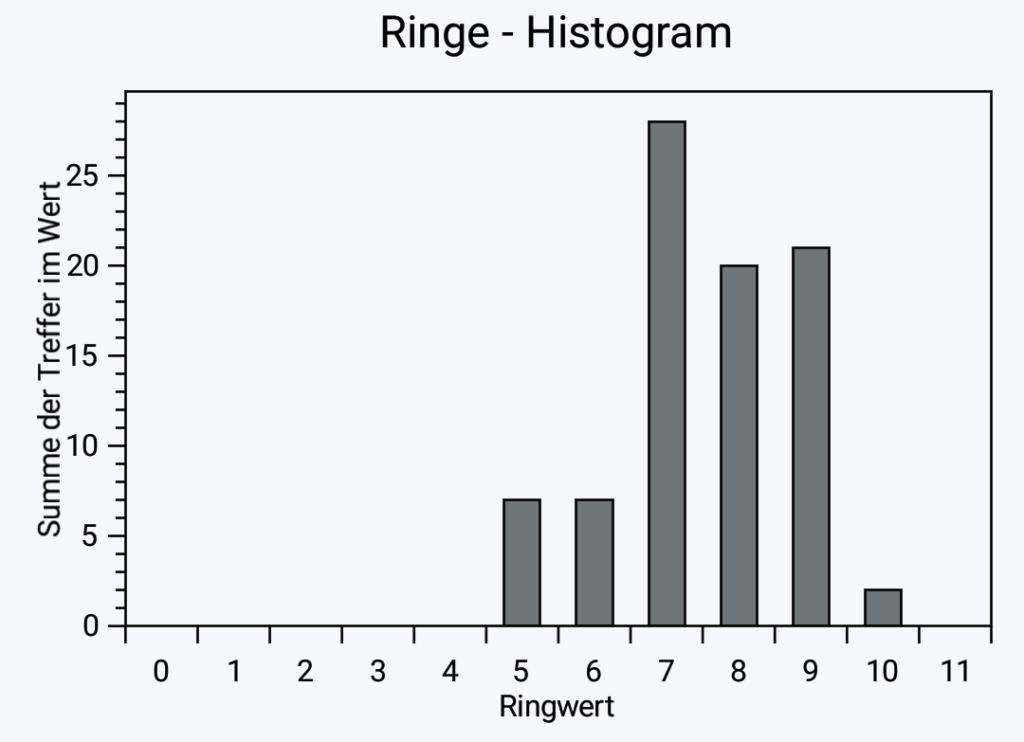
If the data are linked, the individual blocks are no longer differentiated. Data from one source will then be added together from all blocks. This is useful if, for example, you have loaded all the series of an event and you now want to view the total balance of the event.