How do I add specific data to the statistics?
Blackhole’s statistics tool is relatively complex. But it offers a great opportunity to graphically and clearly display your athletic performance and compare values with each other.
In this context, it is important that you are aware of which data you can load into the statistics and how they are then processed there.
Add data
In principle, you can add data to a statistical graphical analysis when you see this symbol. It is important in which context the symbol appears. It indicates that data of some kind exist, which can be used for statistical graphical analysis.
Let’s look at some examples to understand.
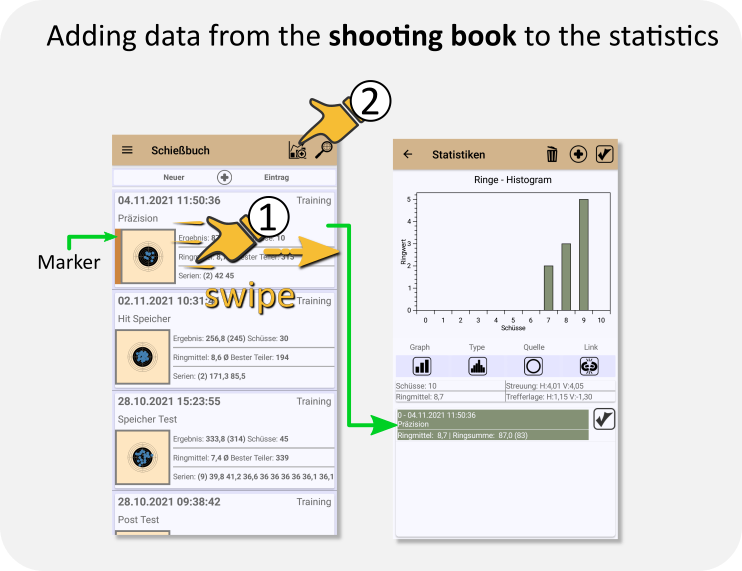
- Mark the events in the shooting book that you want to invite to the statistics. To do this, swipe over an entry from left to right. You can also remove the marker in the same way.
- Then press “add”.
Each event is treated as a single data block. So in this case there is no distinction between the series or the individual slices.
Can I load shooting book entries of a certain type into statisics?

- Open the search and filter menu
- Select a filter value. This differs depending on the data. You can also start a text search or restrict the date. How do I use the filter and search options?
- Add the whole filtered list to the statistics. Each event corresponds again to a data block

If you are in an event view, all series will be added to the statistics page. Each series corresponds to a data block, no matter how many slices are stored in the series. The hits of all targets are summarized in one statistic block.

If you add a series from the detail view to the statistic, all slices of the series become single data blocks.
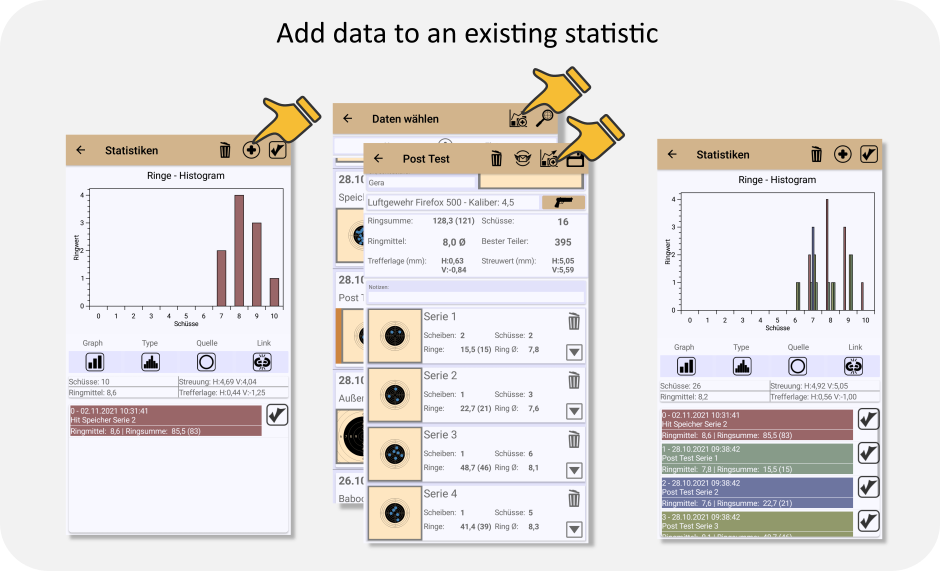
You can load as many data blocks as you want into a statistic to compare them with each other. Of course, only as long as you can keep track of them. Use the Add function and then select your desired data as described above. You can theoretically mix data.
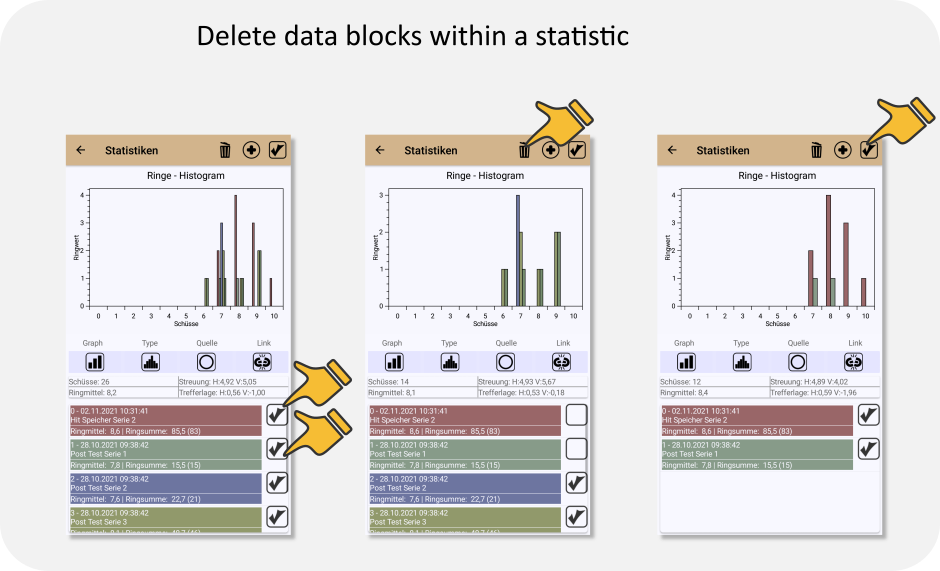
You can include or exclude data blocks in the evaluation with their tick symbol. The chart is always updated live.
If you want to remove blocks from the graphical analysis, select the blocks and use the Delete icon.
The “Select and deselect all” icon in the upper right corner is useful if you want to delete only a single block, for example. Deselect all blocks and select the block you want to delete. After deleting, you can mark all other blocks again in the same way.